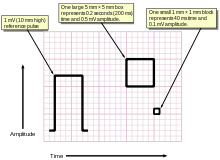
The output of an ECG recorder is a graph (or sometimes several graphs, representing each of the leads) with time represented on the x-axis and voltage represented on the y-axis. A dedicated ECG machine would usually print onto graph paper which has a background pattern of 1mm squares (often in red or green), with bold divisions every 5mm in both vertical and horizontal directions. It is possible to change the output of most ECG devices but it is standard to represent each mV on the y axis as 1 cm and each second as 25mm on the x-axis (that is a paper speed of 25mm/s). Faster paper speeds can be used - for example to resolve finer detail in the ECG. At a paper speed of 25 mm/s, one small block of ECG paper translates into 40 ms. Five small blocks make up one large block, which translates into 200 ms. Hence, there are five large blocks per second. A calibration signal may be included with a record. A standard signal of 1 mV must move the stylus vertically 1 cm, that is two large squares on ECG paper.
source : en.wikipedia


0 comments:
Post a Comment